Skip to main content
Inflammatory Bowel Diseases
20th Congress of ECCO, February 19–22, 2025, Berlin, Germany
Our Congress
ECCO’25 Overview
Words of Welcome
Organising Committee
Useful Information & Addresses
Opening Hours
Congress and Exhibition Floor Plans
EACCME
ECCO’25 Film
ECCO’25 Photo Gallery
Discover the Programme
Programme Overview
Educational Programme
Industry Sessions
EFCCA Conference
Pocket Guide
Register
Registration, Booking and Badges
e-Vouchers for groups
Terms and Conditions
ECCO Interaction: Hearts and Minds
Visa invitation letter
Media Policy
ECCO’25 Checklist
Especially for members
Abstracts
Abstract Submission
Guidelines for abstracts submission
Guidelines for presentations
ECCO Abstract Awards
ECCO’25 Abstracts
Exhibit & Sponsor
Hotel Booking
Explore Berlin
FAQ
Download
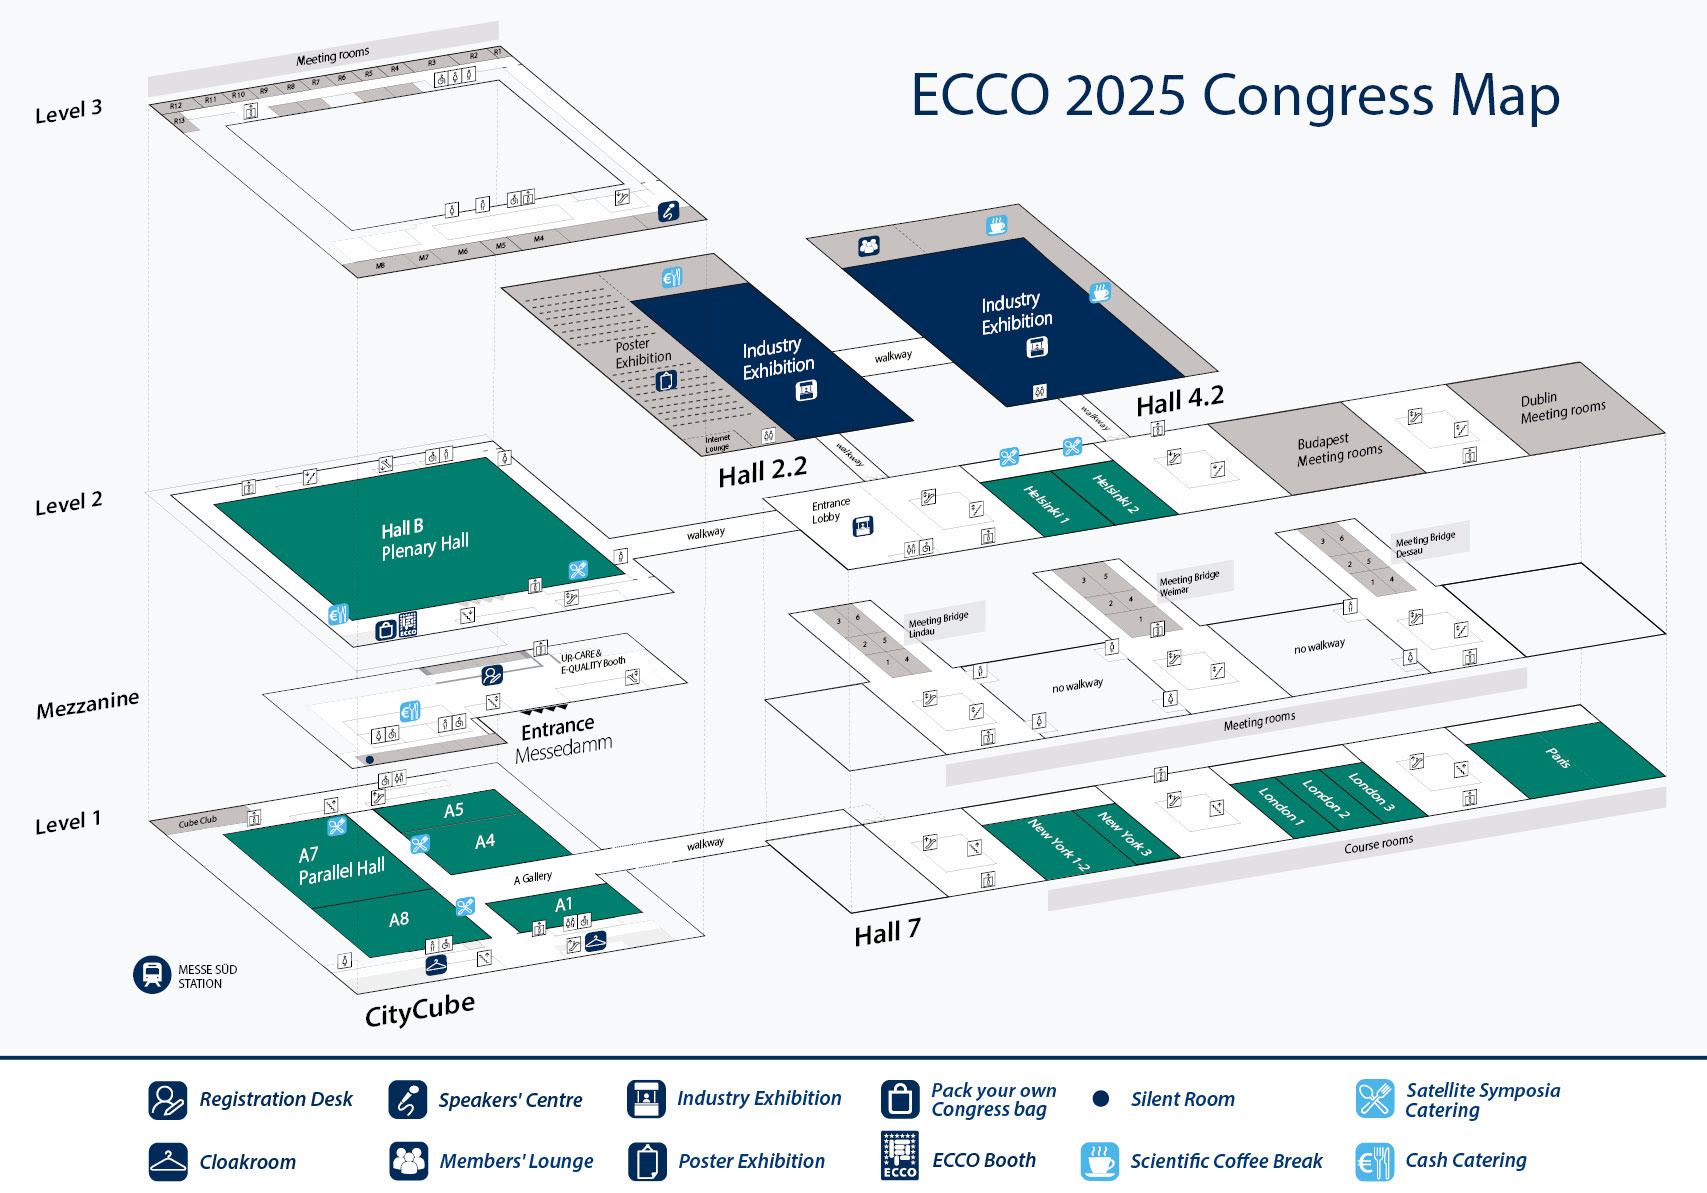
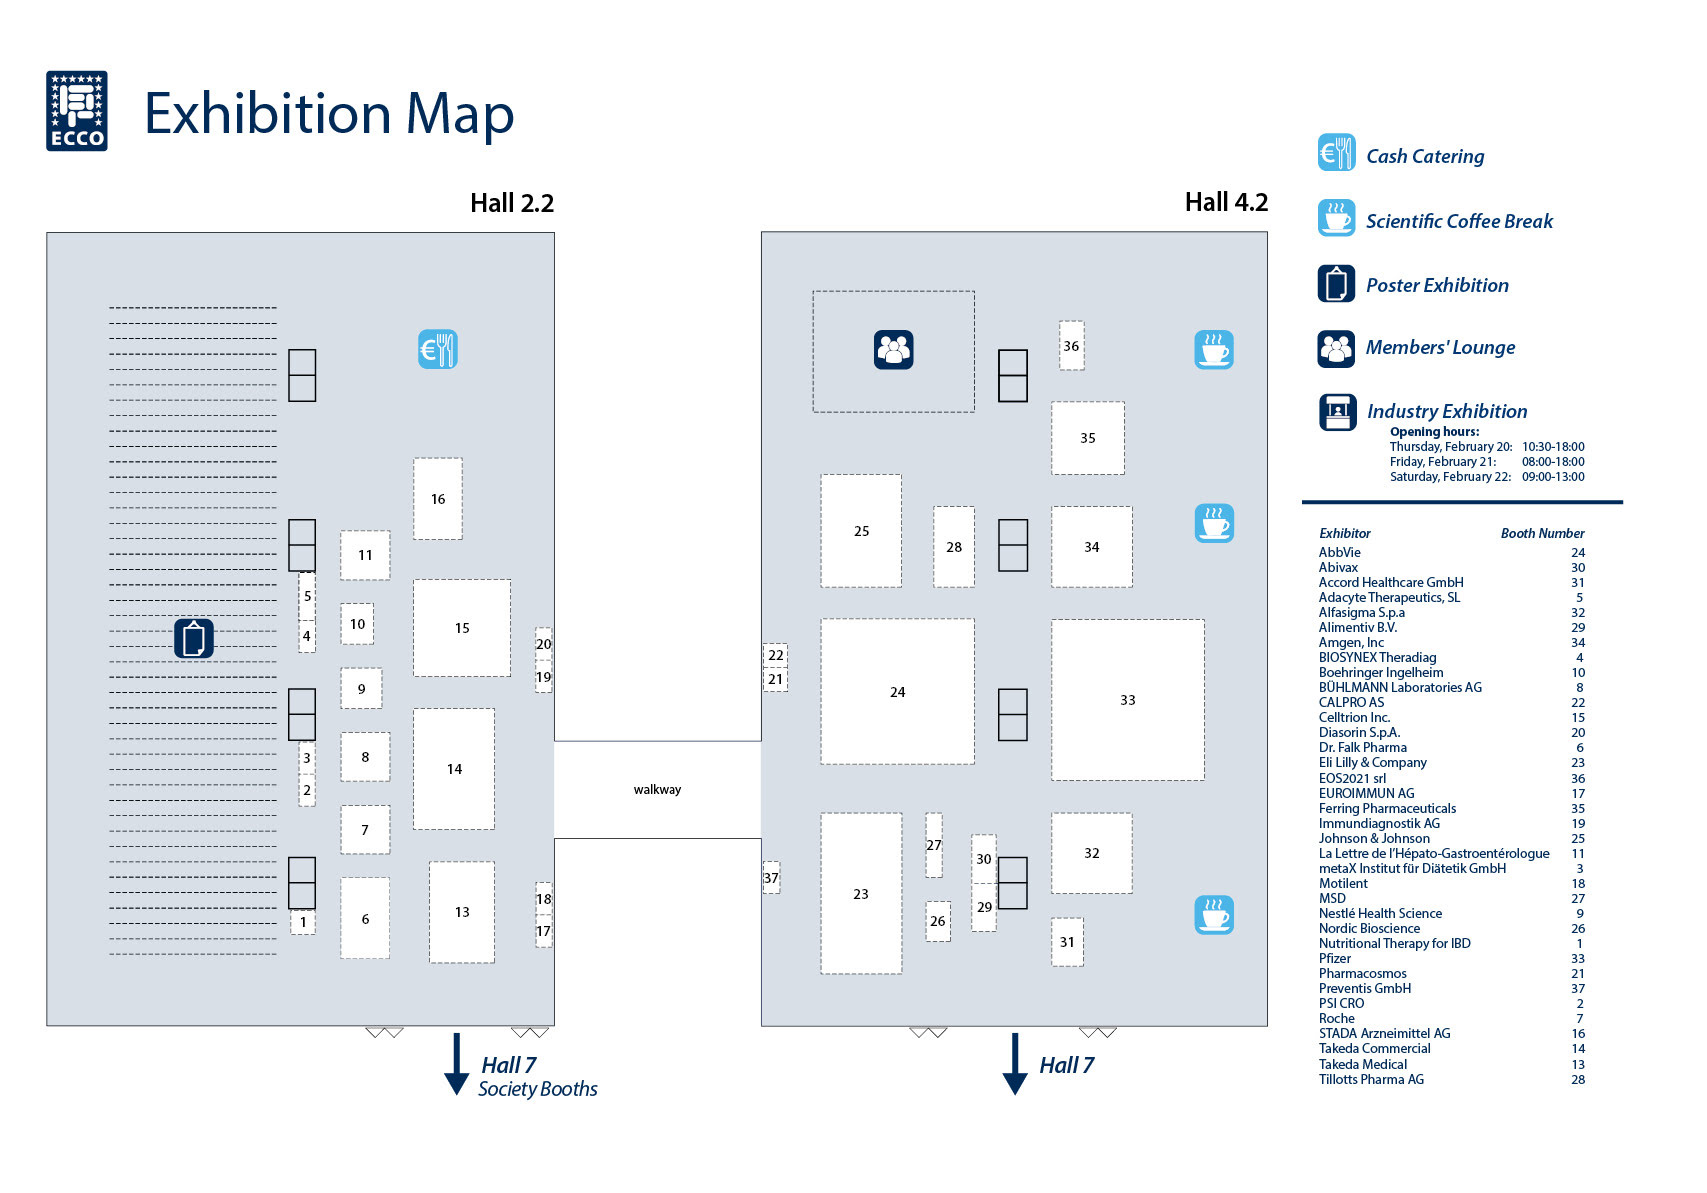
Congress and Exhibition Floor Plans
ECCO’25 Congress Map
Download
ECCO’25 Exhibition Map
Download