ECCO Congress 2026 – Top 20 countries
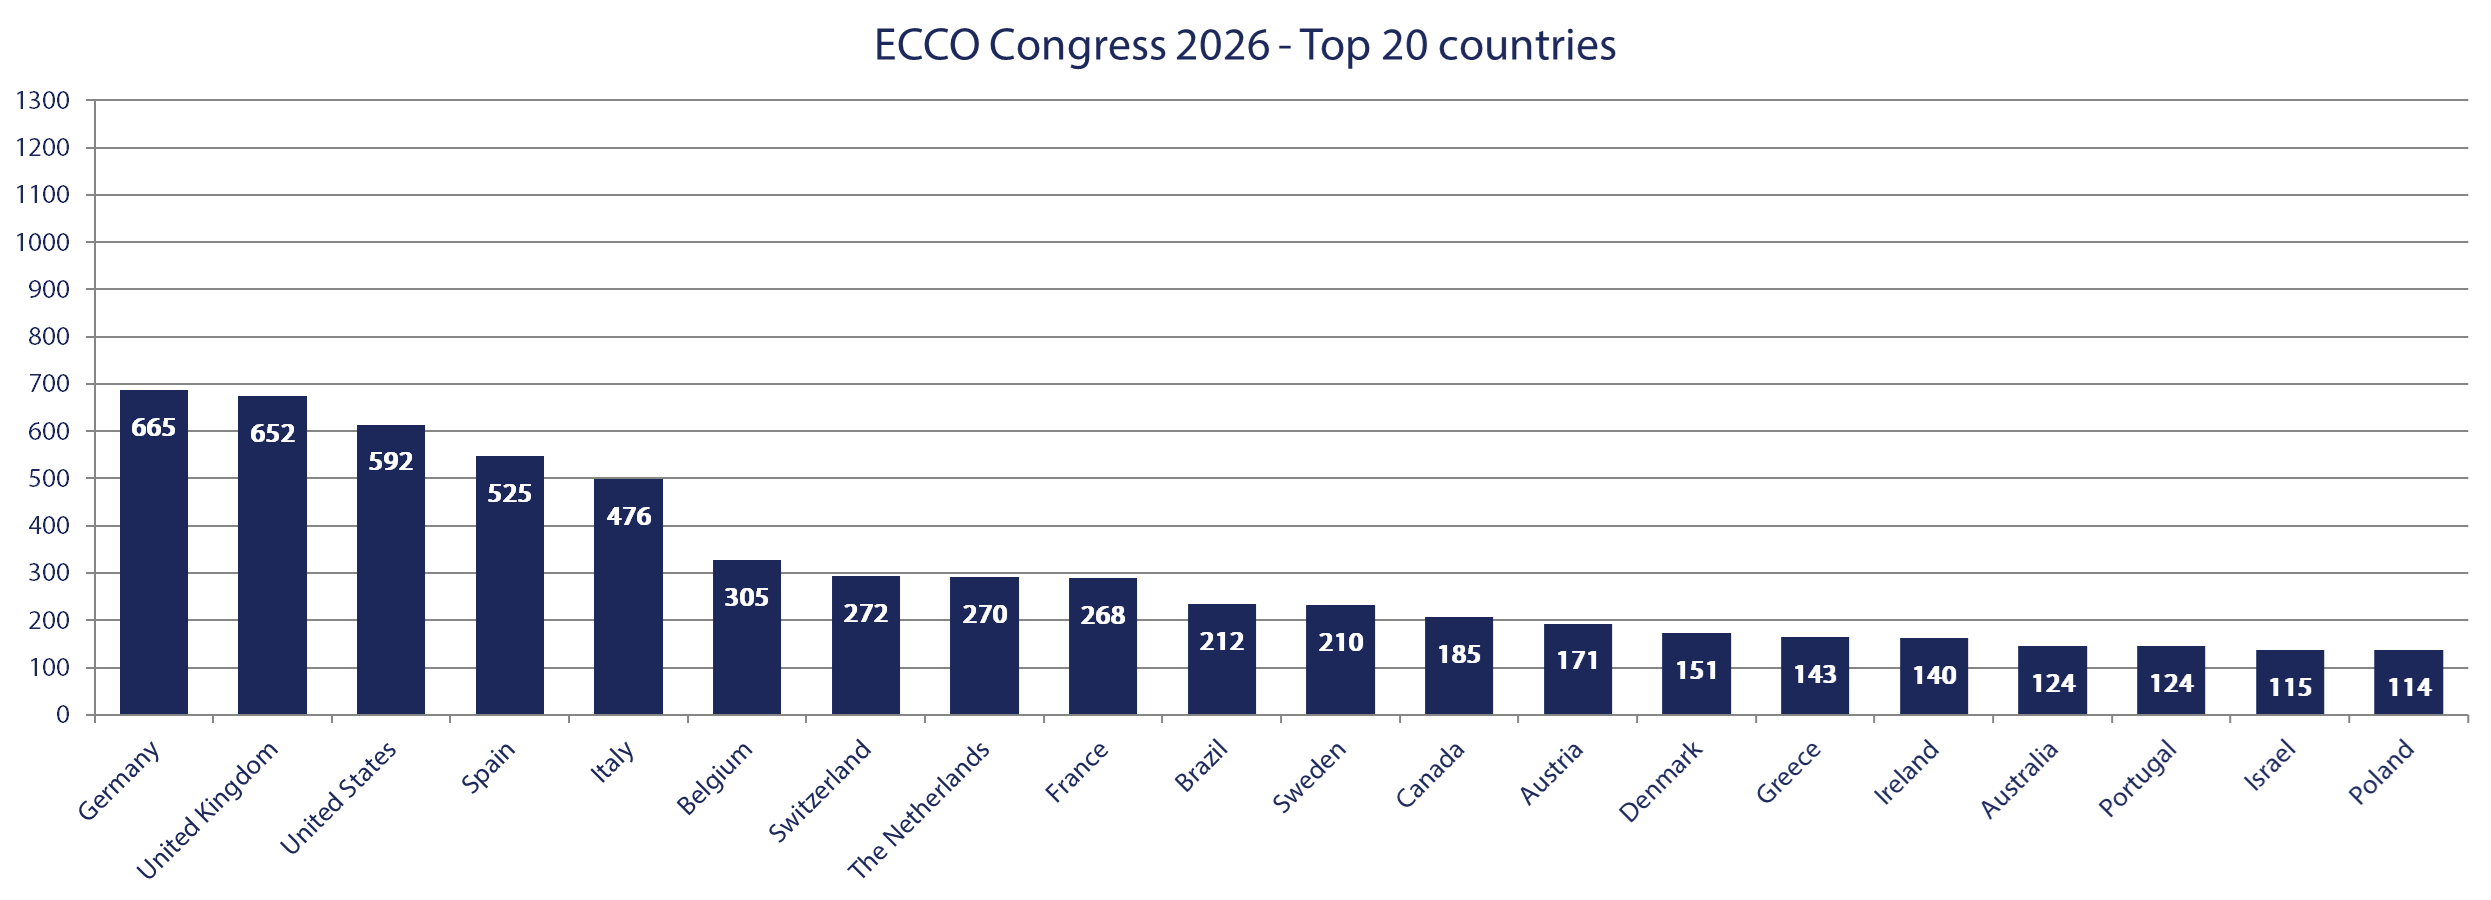
ECCO Congress participation 2026 – Top 20 countries © ECCO
ECCO Congress 2026 – Professions
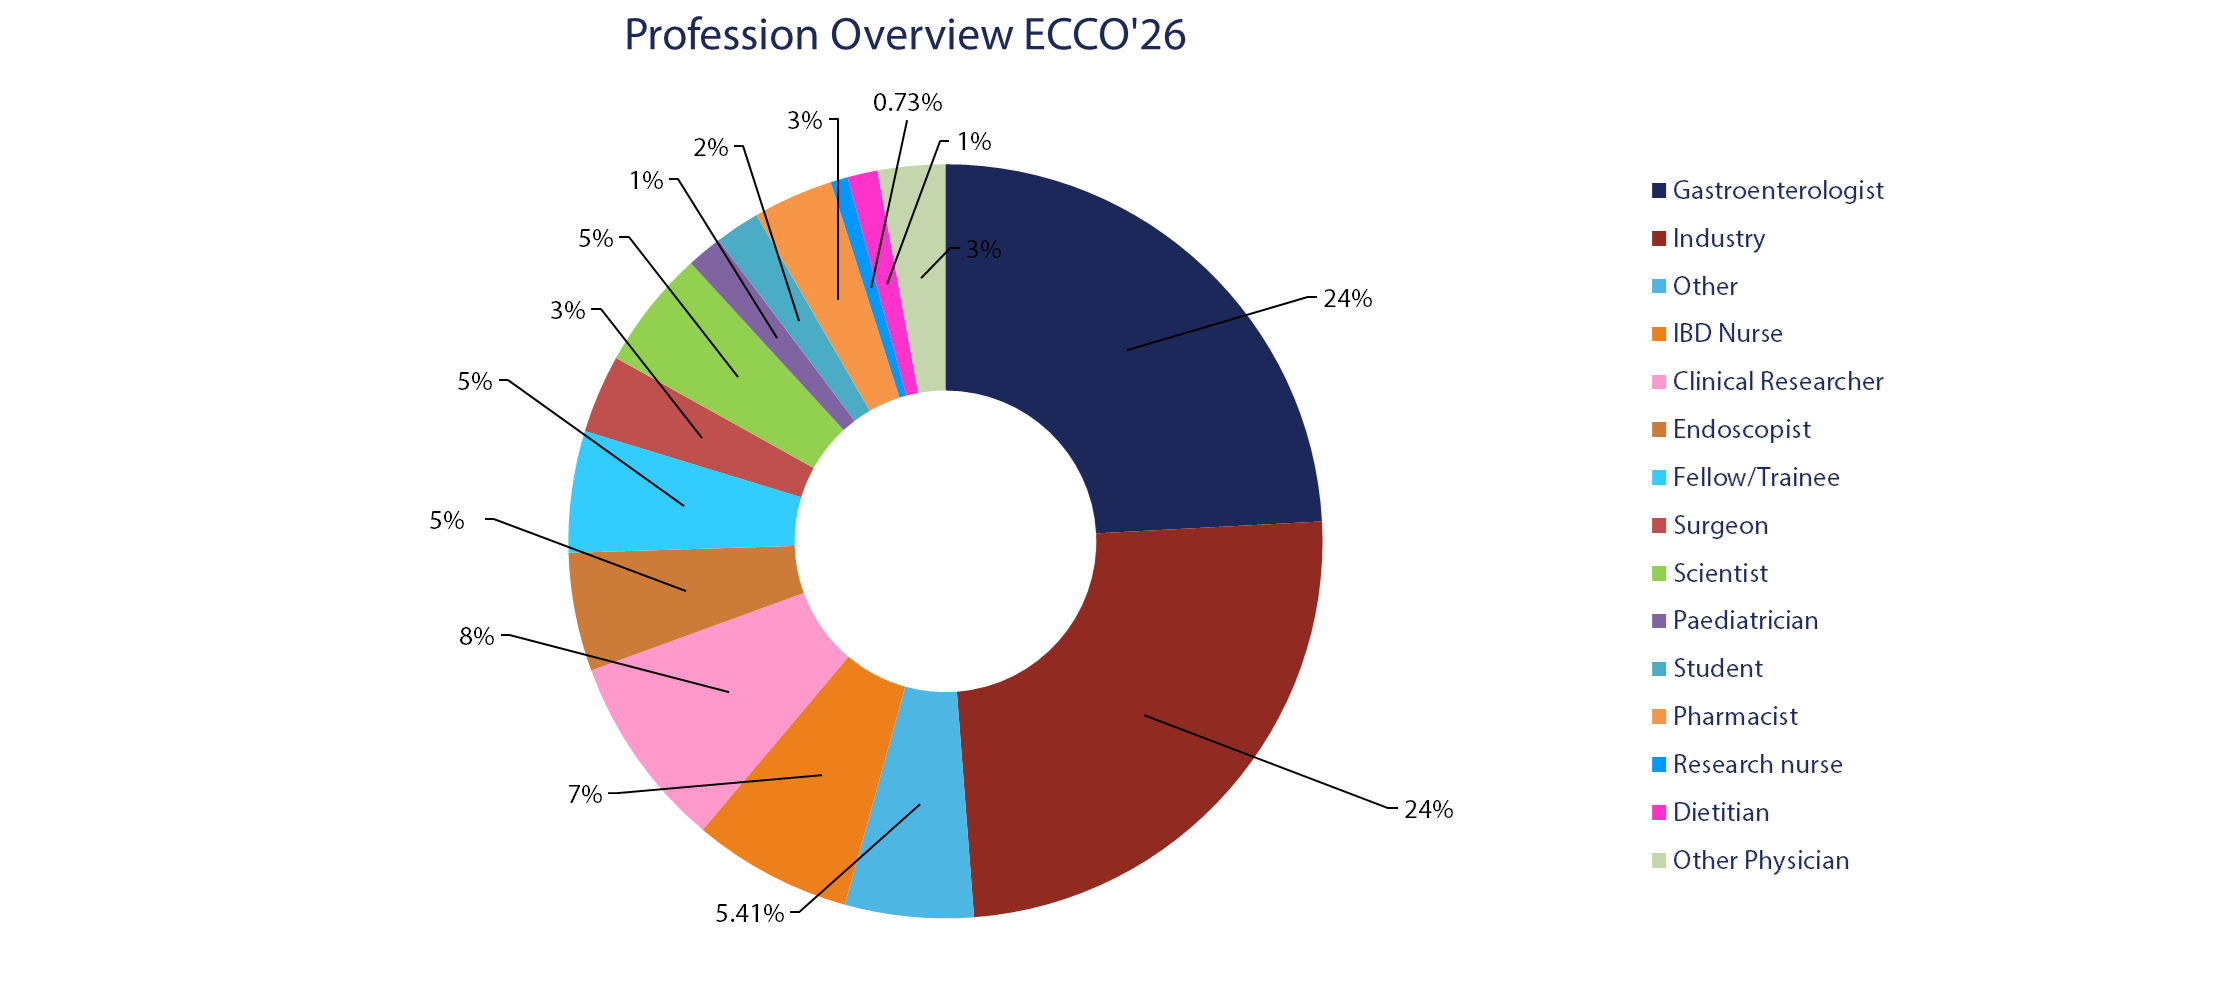
ECCO Congress participation 2026 – Professions © ECCO
ECCO Congress 2026 – World regions representation
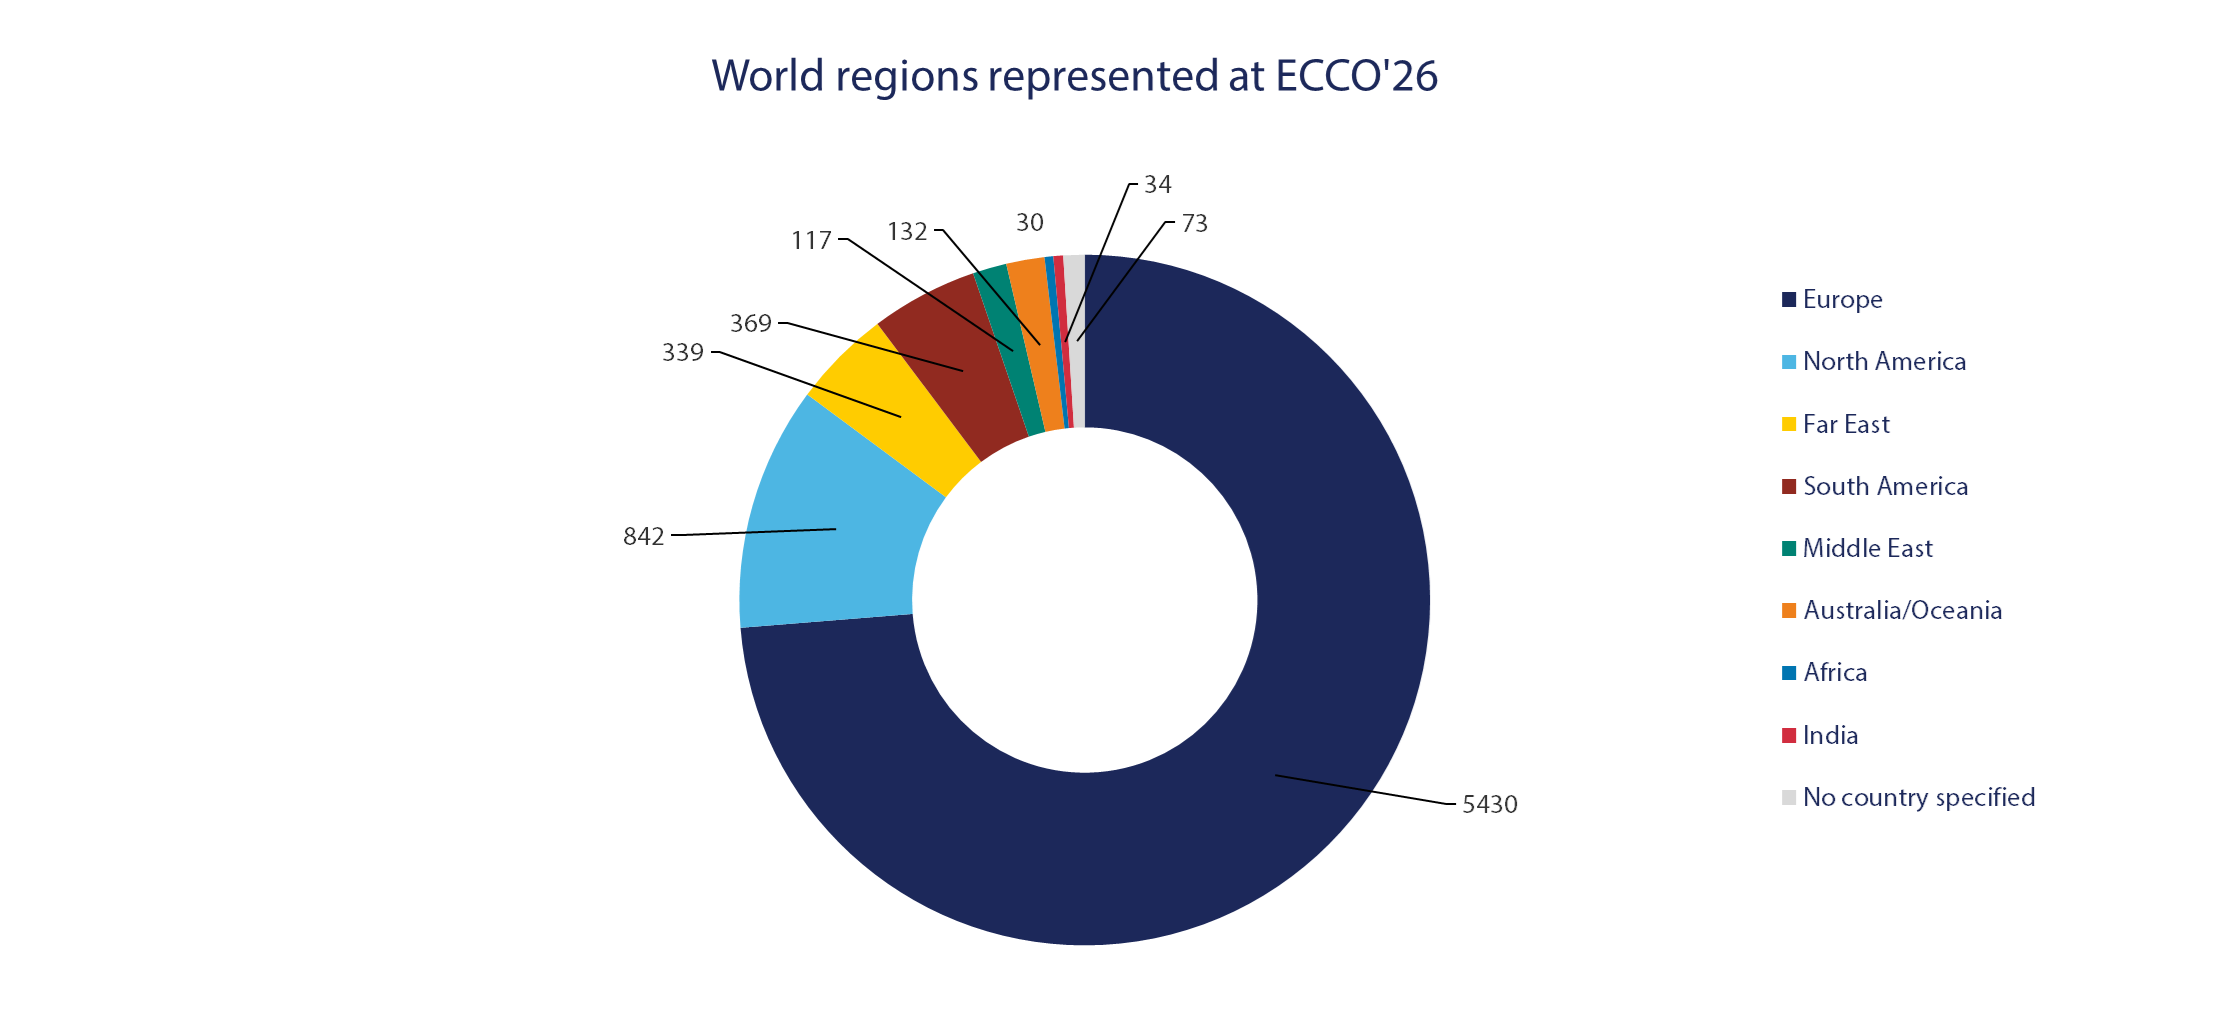
ECCO Congress participation 2026 – World regions © ECCO
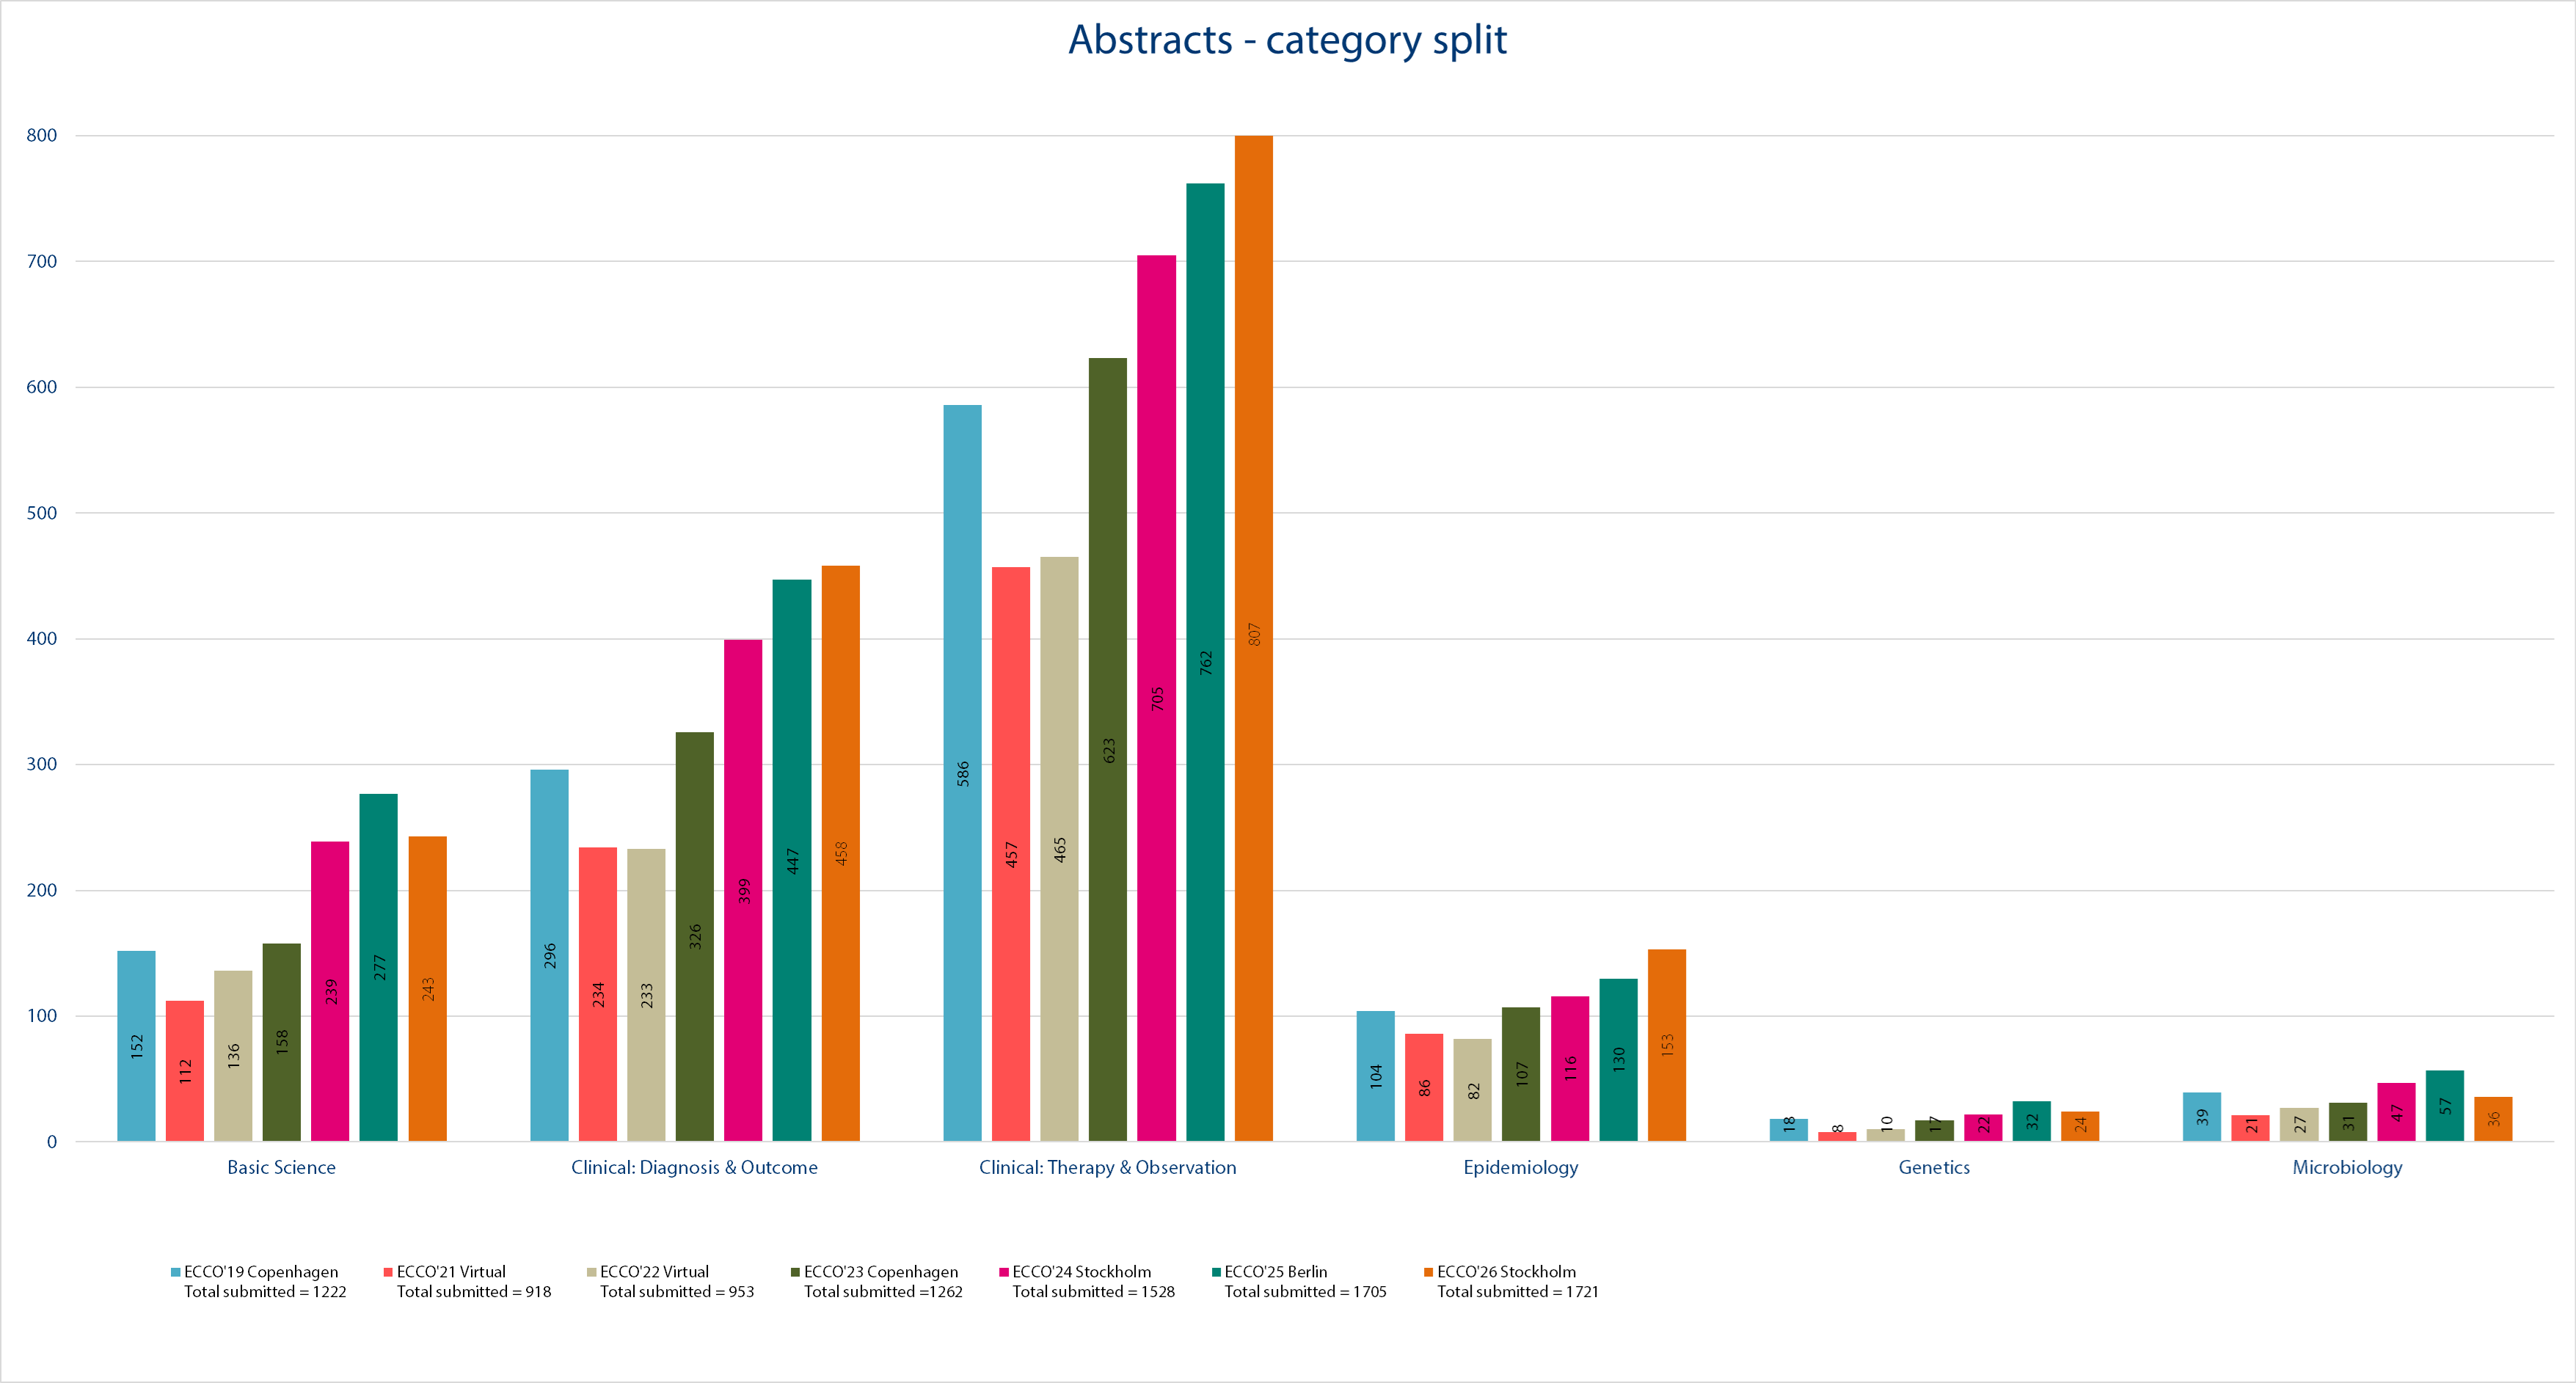
Abstracts – Accepted vs. Rejected
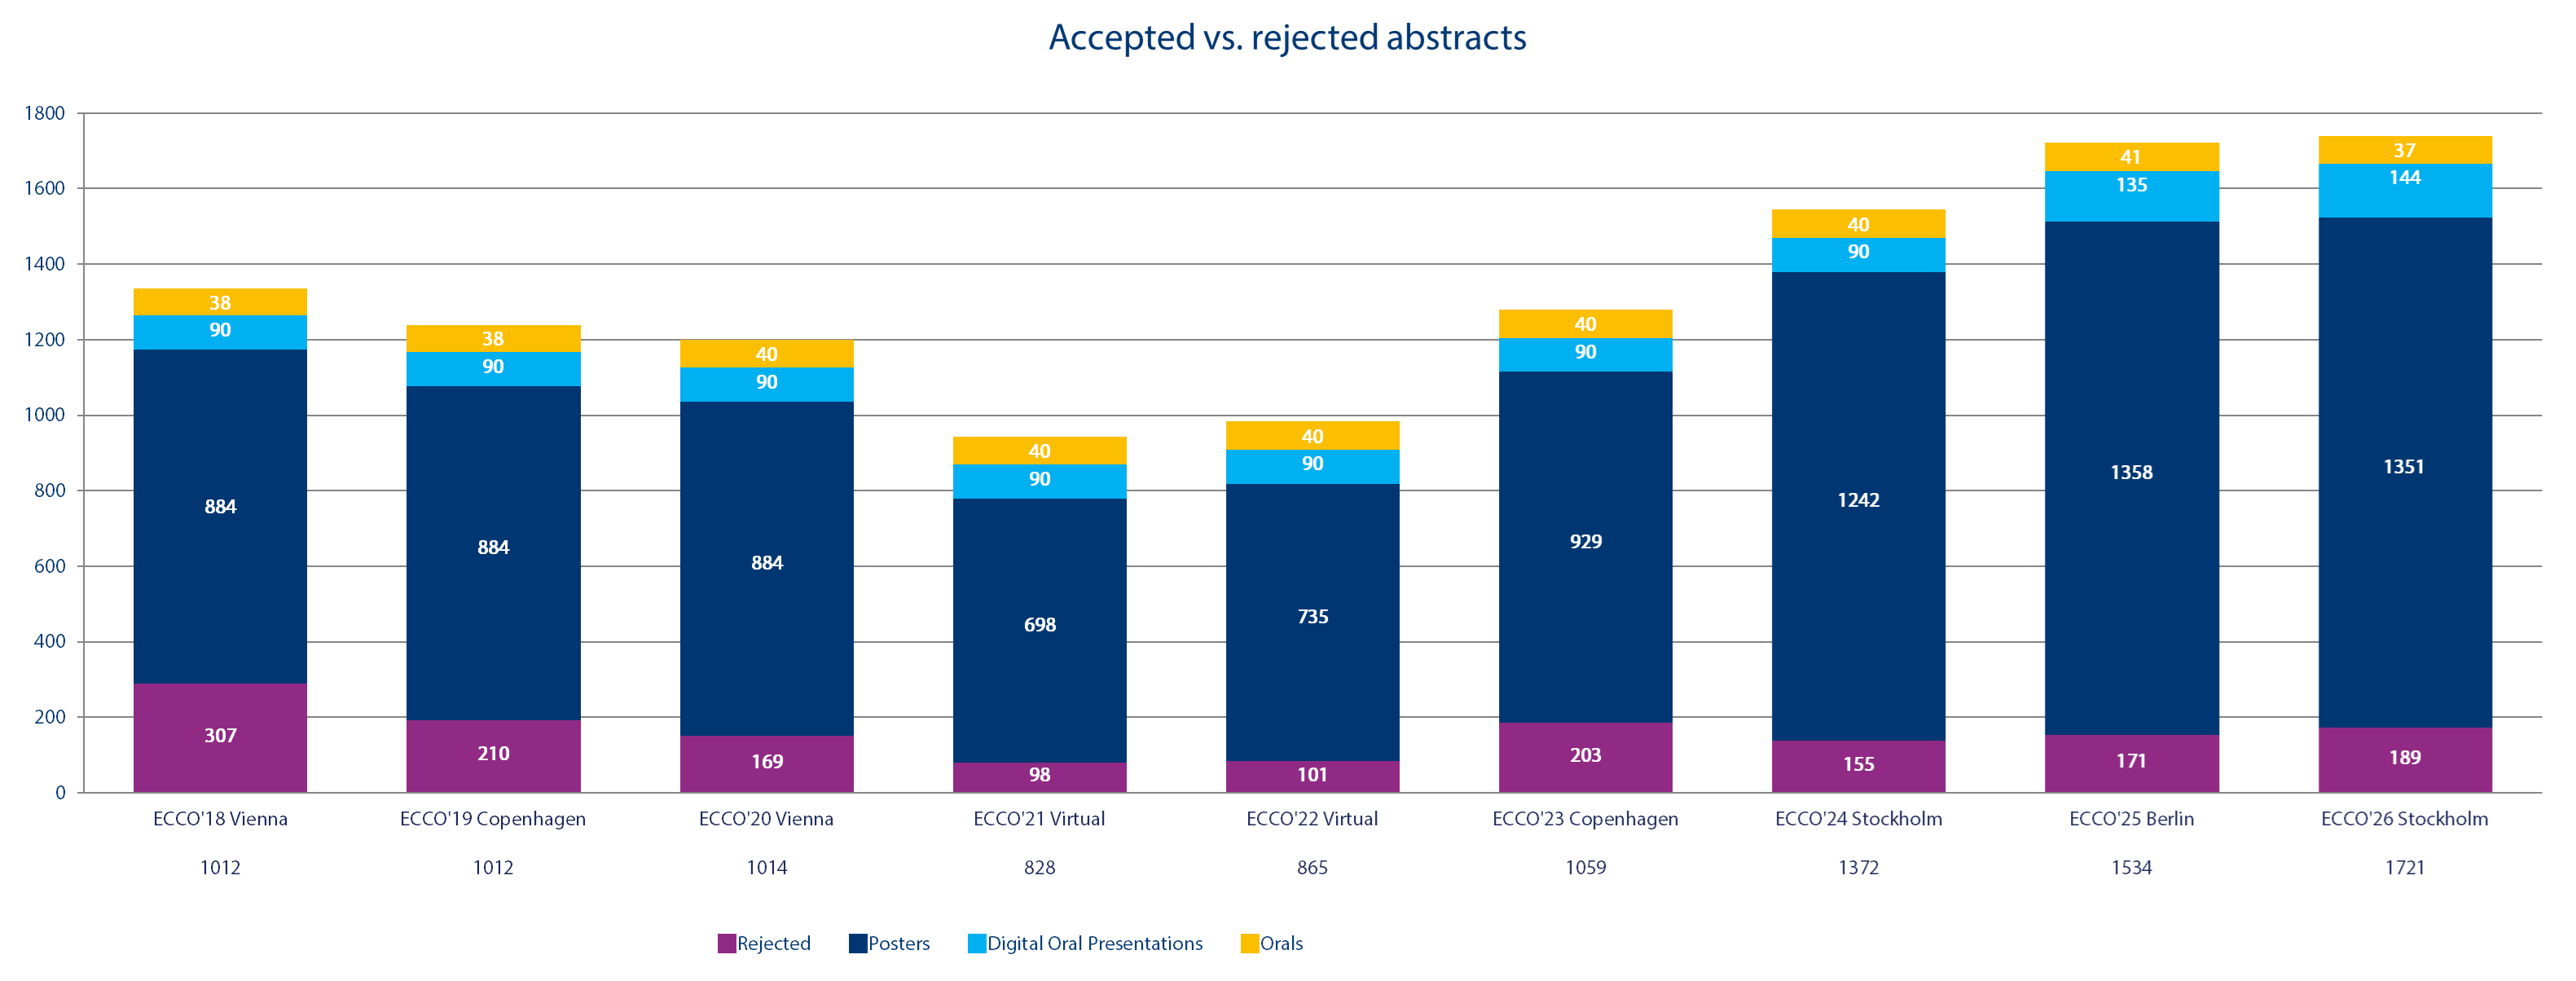
Accepted versus rejected abstracts 2018-2026 © ECCO