
DOP48 Gene expression landscape of epithelial monolayer in inflammatory bowel disease
S. Sæterstad1, A.E. Østvik2,3, A.K. Sandvik1,2,3, A. Granlund Van Beelen1
1Centre of Molecular Inflammation Research, Norwegian University of Science and Technology NTNU, Trondheim, Norway, 2Department of Clinical and Molecular Medicine, Norwegian University of Science and Technology NTNU,Trondheim, Norway, 3Department of Gastroenterology, St. Olav’s University Hospital, Trondheim, Norway
Background
Gene expression analyses on IBD tissue are dominated by analyses of biopsy homogenates that are highly heterogeneous due to a difference in cell populations when contrasting inflamed vs. healthy mucosa. We wished to characterise the inflammatory activity of the isolated epithelial monolayer (EM), avoiding the infiltrating inflammatory cells, thereby form a comprehensive understanding of the epithelium’s role in IBD pathobiology.
Methods
Total RNA was isolated from laser capture microdissected (LCM) colon EM, and sequencing libraries were prepared using TruSeq RNA access kit (Illumina, CA, USA). Gene cluster analysis (WGCNA) was used to stratify the expression data in genetic modules. Following this, we characterised the modules correlated to IBD status, using Metacore pathway analysis, in order to suggest what underlying biological processes contribute to the observed correlation of expression data. Finally, we used immunohistochemistry to verify the protein expression pattern of key players in the suggested pathways, thereby confirming EM involvement in these processes during inflammation.
Results
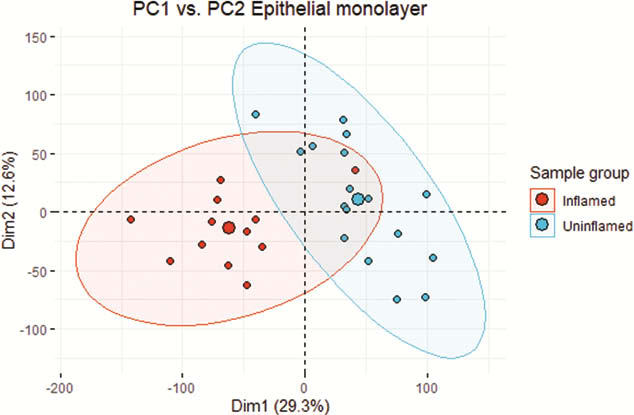
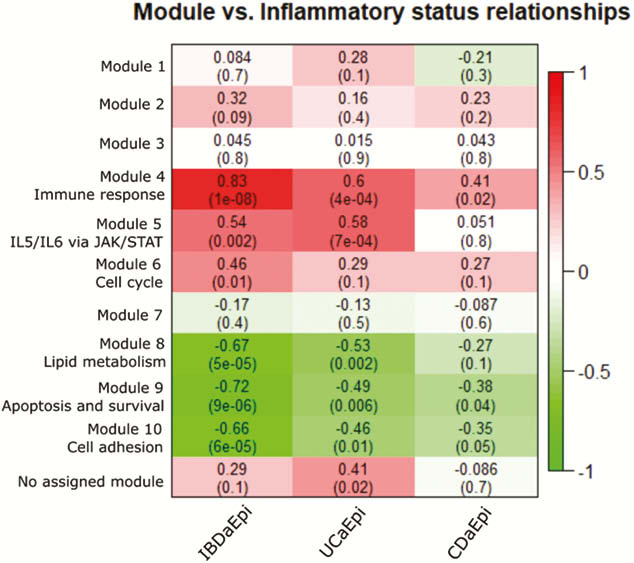
Biopsies from active (a) IBD (7 UCa, 5 CDa) and from un-inflamed (u) IBD and healthy control (7 UCu, 5 CDu and 6 HC) were included in the analysis. 6386 genes were differentially expressed (adjusted p-value (pval.) <0.05) in EM from active inflamed colon vs. un-inflamed (Figure 1). Six gene modules showed a significant correlation between inflammatory status and gene expression (Figure 2). Of note was a broad, significant up-regulation of MHC class II presentation machinery, e.g. STAT1 (log2 fold change (lfc) 0.93,
Conclusion
Our analyses suggest that the involvement of the EM in IBD inflammation goes far beyond acting as a barrier. The largest genetic modules are dominated by genes important for inflammatory regulation, suggesting that the EM is much more involved in these processes than what is commonly understood. This study lends support to further analyses of interplay between epithelial cells and immune cells, particularly in a pro-inflammatory environment.