
OP28 Gene expression (GE) values in a phase 2 trial of mirikizumab in ulcerative colitis (UC) correlate better with histopathology (HP) than endoscopy (EN) and Mayo scores
B. Steere1, K. GOTTLIEB1, J. Schmitz2, R. Higgs1, B. Jia1, C. Milch1, J. Tuttle3, V. Krishnan1, R. Belin1, W. Reinisch4
1Department of Immunology, Eli Lilly and Company, Indianapolis, USA, 2Department of Discovery Sciences, Eli Lilly and Company, Indianapolis, USA, 3Department of Discovery Sciences, Eli Lilly and Company, San Diego, USA, 4Department of Gastroenterology, Medical University Vienna, Vienna, Austria
Background
HP is considered integral to the definition of mucosal healing of UC. The regulated transcription of genes determines cell identity and function, and, consequentially, HP and EN appearance. Here we correlate GE in a UC clinical trial with EN and HP indices, and the modified Mayo score (MMS).
Methods
249 patients. with moderately-to-severely active UC were randomised to placebo or different doses of mirikizumab, a p19-directed IL-23 antibody (NCT02589665). Gene expression in baseline biopsy samples from the most affected area in the colon was evaluated using Affymetrix HTA2.0 exon-format microarray with a typical Bioconductor workflow (DOI: 10.1186/gb-2004-5-10-r801). Genes were represented by their largest groups of highly correlated exon groups. Expression values were correlated with Robart‘s Histopathology Index (RHI), Geboes score (GS), Ulcerative Colitis Endoscopic Index of Severity (UCEIS), and modified Mayo score (MMS) at baseline. A threshold of false-discovery rate (FDR)-adjusted
Results
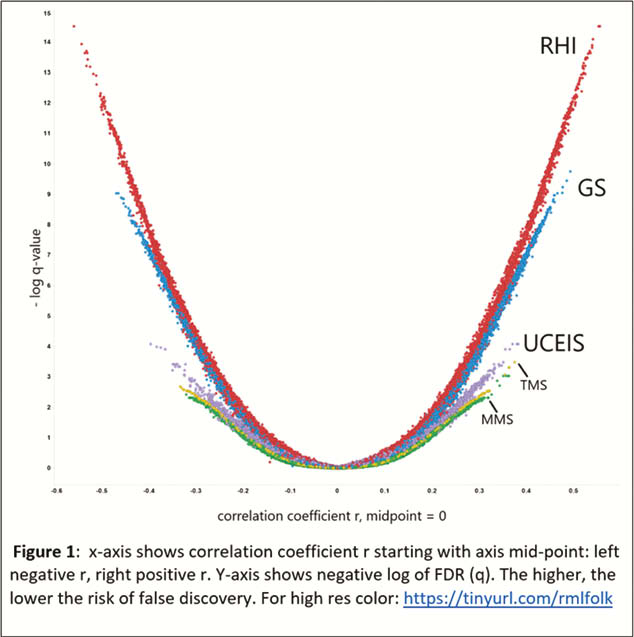
The plot (Figure 1) shows more genes with expression values that correlate significantly (
Conclusion
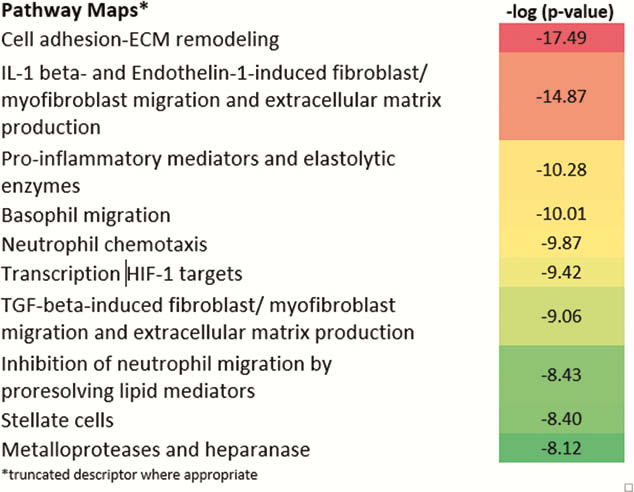
In our analysis, RHI tracked baseline gene expression values best, followed by another HP index (GS), followed by EN (UCEIS) and finally MMS. Judging by the orders-of-magnitude greater significance of correlation with gene expression values, the histology indices are particularly information-rich. Regulated gene expression, fundamental to a phenotypic appearance in HP, seems to best mirrored by the RHI, followed by GS. The genes that track with all indices predominantly modulate cell adhesion and leukocyte trafficking. The genes that are unique to the UCEIS, compared with the RHI, do not significantly belong to any recognisable pathway or network. Further evaluation of what current EN scores contribute relative to HP disease activity assessment in UC may be useful.