
P113 Serum adipokines as non-invasive biomarker in Crohn’s disease
L. Ortega Moreno1, A. Sanz-Garcia2, M.J. Fernández de la Fuente3, R. Arroyo Solera4, M. Chaparro5, S. Fernandez-Tome6, A.C. Marin7, I. Mora-Fernandez6, P. Fernandez4, M. Baldan-Martin7, D. Bernardo8,9, J.P. Gisbert5,9
1Universidad Autónoma de Madrid. Hospital Universitario de La Princesa, Medicina, Madrid, Spain, 2Unidad de Análisis de Datos. Hospital Universitario de La Princesa, Análisis de Datos, Madrid, Spain, 3Universidad de Alcalá., Farmacia, Alcalá de Henares Madrid, Spain, 4Instituto de Medicina Molecular Aplicada IMMA. Universidad San Pablo CEU., Medicina, Madrid, Spain, 5Universidad Autónoma de Madrid. Hospital Universitario de La Princesa. CIBERehd., Medicina, Madrid, Spain, 6Hospital Universitario de La Princesa, Medicina, Madrid, Spain, 7Hospital Universitario de La Princesa. CIBERehd., Medicina, Madrid, Spain, 8Mucosal Immunolgy lab. Instituto de de Biología y Genética Molecular IBGM., Medicina, Valladolid, Spain, 9Both authors had equal contribution- as senior authors, Medicina, Madrid, Spain
Background
Adipose tissue wrapping the gastrointestinal tract is a risk factor for disease activity in Crohn’s disease (CD). Indeed, adipokines associated to lipid metabolism can modulate local immune responses. However, few studies have investigated the possible association between adipokines and CD. Here, we aimed to evaluate the role of serum adipokines as possible biomarkers in CD.
Methods
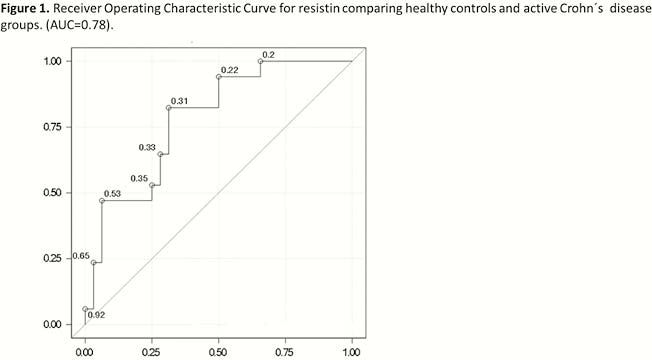
Serum samples were obtained from 18 patients with endoscopically active CD (aCD), 22 patients with endoscopically quiescent CD (qCD) and 36 non-inflamed healthy controls (HC). Serum leptin, ghrelin, resistin and adiponectin were analysed by Multiplex (Bio-Rad, Hercules, CA) in a Luminex 200 system technology. Adipokines means for each group of patients were compared and adjusted by Bonferroni or Wilcoxon tests. Receiver operating characteristic (ROC) curves and the area under the curve (AUC) were carried on to evaluate the discriminatory capacity of the adipokines levels between patients groups. Furthermore, for those adipokines that showed an AUC > 0.7, a binary logistic regression adjusted by possible confounders (i.e. sex, age and BMI) was performed in order to test their possible association with CD.
Results
No differences were found in age, sex or BMI among aCD, qCD and HC; there was no correlation either among the adipokines analysed. Means distribution for serum resistin was different among aCD, qCD and HC (
Conclusion
Resistin may modulate the inflammation state in CD and it is probably associated to activity, being this association independent of sex, age or BMI.