P736 Factors associated with partial Mayo Clinic Score over time in patients with Ulcerative Colitis treated with filgotinib in the phase 2b/3 SELECTION trial
Peyrin-Biroulet, L.(1)*;Louis , E.(2);Hisamatsu, T.(3);Jamoul, C.(4);Santermans, E.(4);Harris , K.(5);de Haas, A.(6);Oortwijn , A.(7);Feagan , B.(8);
(1)Hopitaux De Brabois, Department of Gastroenterology and Inserm U954, Vandoeuvre-Lès-Nancy, France;(2)University Hospital of Liège, Department of Gastroenterology, Liege, Belgium;(3)Kyorin University School of Medicine, Department of Gastroenterology and Hepatology, Tokyo, Japan;(4)Galapagos NV, Biostatistics Department, Mechelen, Belgium;(5)Galapagos NV, Medical Evidence Generation Department, Milan, Italy;(6)Galapagos NV, Clinical Development Department, Leiden, The Netherlands;(7)Galapagos NV, Medical Affairs Department, Leiden, The Netherlands;(8)Western University, Division of Gastroenterology, London- ON, Canada;
Background
Responses to ulcerative colitis (UC) treatments vary considerably between individuals, and factors associated with a stable response are not well defined. Filgotinib (FIL) is an oral, Janus kinase 1 preferential inhibitor approved in the EU and the UK as a UC therapy. We aimed to identify factors associated with partial Mayo Clinic Score (pMCS) over time in FIL-treated patients with UC in the phase 2b/3 SELECTION trial (NCT02914522).
Methods
In SELECTION, adults with moderately to severely active UC received FIL 200 mg (FIL200), FIL 100 mg (FIL100) or placebo once daily for 11 weeks in Induction (IND) Study A (biologic-naive) or B (biologic-experienced).1 Patients in clinical remission or with a Mayo Clinic Score (MCS) response at week 10 could enter the 47-week Maintenance (MNT) Study. To evaluate factors associated with pMCS during MNT this post hoc analysis used a mixed model for repeated measures (MMRM), which included fixed effects of time, IND dose (FIL200 or FIL100), the factor of interest and pMCS at IND baseline, and correlated patient residual errors. For categorical factors, the least-squares mean difference with 95% confidence interval (CI) and the overall type III p value were calculated. For continuous factors, the difference in pMCS for a one-unit change in the factor of interest was estimated with 95% CI. Multiplicity adjustment of p values was not performed.
Results
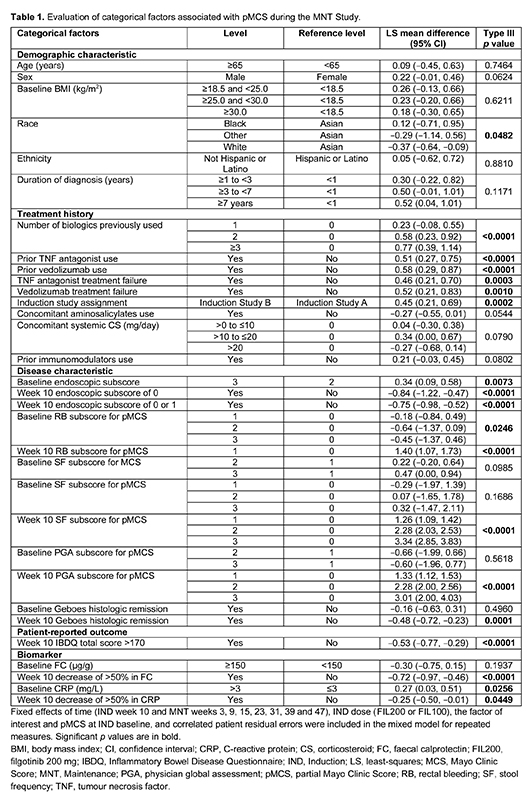
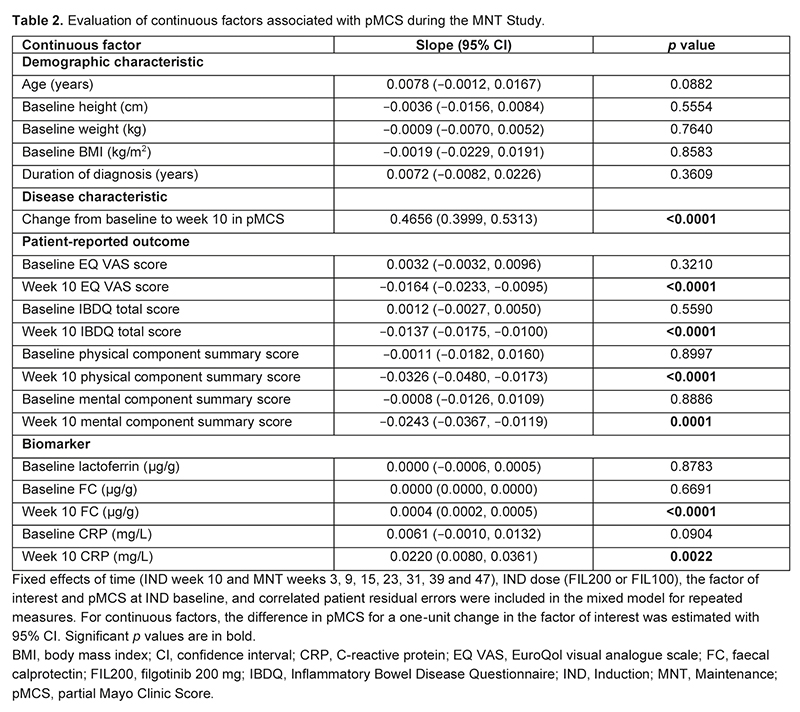
Data from 371 patients treated with FIL200 (n=199) or FIL100 (n=172) were included. Previous use of at least one biologic therapy or a tumour necrosis factor antagonist/vedolizumab, and week 10 MCS subscores of ≤1 were associated with higher pMCS over time than their respective reference categories (p<0.0001; Table 1). Over time, pMCS was 0.45 units higher in patients assigned to IND Study A versus IND Study B (p=0.0002). Week 10 endoscopic score ≤1, Geboes histologic remission and Inflammatory Bowel Disease Questionnaire total score >170 were associated with lower pMCS over time than their respective reference categories (p≤0.0001). Change from baseline in pMCS at week 10 and faecal calprotectin levels at week 10 were positively associated with pMCS over time (p<0.0001; Table 2). Patient-reported outcome (PRO) measures at week 10 were negatively associated with pMCS over time (p≤0.0001).

Conclusion
History of previous biologic therapy, and week 10 assessments (endoscopic, clinical, biomarker and PRO) were among the factors influencing pMCS over the course of 1 year of FIL treatment, consistent with previous findings from trajectory modeling.2 Further MMRM analyses may help to identify patients who benefit most from FIL treatment.
1. Feagan BG et al. Lancet 2021;397:2372–84.
2. Schreiber S et al. MP443 [abstract]. UEGJ 2022;10:459.


