
P826 A predictive molecular classification developed in UC patients with active disease is observed consistently in a heterogeneous group of IBD patients
K. Kulmala1, O.E. Diaz1, S. Huber2, C. Hedin3, E.J. Villablanca1
1Division of Immunology and Allergy, Department of Medicine- Solna- Karolinska Institutet and University Hospital- 17176 Stockholm- Sweden. Center of Molecular Medicine- 17176, Stockholm, Sweden, 2Department of Medicine, University Medical Center, Hamburg-Eppendorf, Germany, 3Gastroenterology unit- Patient Area Gastroenterology- Dermatovenereology and Rheumatology- Karolinska University Hospital- Stockholm- Sweden, Department of Medicine- Solna- Karolinska Institutet- 17176, Solna, Sweden
Background
We have previously identified an unsupervised molecular classification of ulcerative colitis (UC) into two groups, UC1 and UC2, predictive of response to biologic therapy1. In that study, gene expression data in inflamed colonic biopsies from several published UC cohorts were used. UC1 is characterised by, for example, high expression of Cytochrome P450 26B1 (CYP26B1), calprotectin (S100A8) and interleukin 11 (IL11) and poor response to infliximab, which is also predicted by high expression of oncostatin M (OSM)2. In the current study the consistency of this classification was investigated in a heterogeneous group of inflammatory bowel disease (IBD) patients. Also, we sought to validate a quantitative polymerase chain reaction (qPCR) primer set as an alternative, more convenient methodology instead of microarray.
Methods
PCR primers for 7 differentially expressed genes that distinguished UC1 from UC2 in our microarray study were validated. OSM was also included. Separate gut biopsy samples (
Results
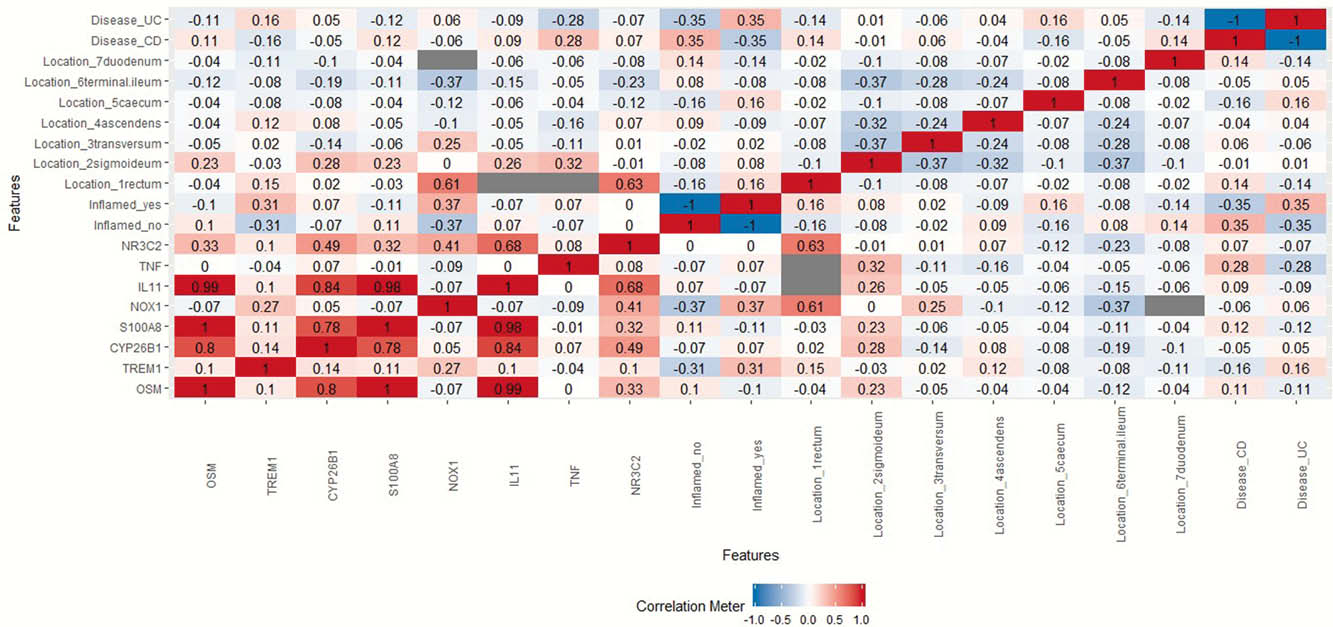
A heatmap of Pearson correlation coefficients (r) between gene expression levels and clinical factors for the pooled data was generated, Figure 1. Strong correlations, defined as 0.7 ≤
Conclusion
These data demonstrate that the group genes we have previously identified as predictive of response to biologic therapy in UC, (CYP26B1, S100A8 and IL-11) plus OSM are also concordantly up-regulated in biopsy material from heterogeneous patients. Thus not only patients with active UC, but also other forms of IBD may be sub-grouped according to this gene expression pattern. The capacity of this gene expression profile to predict therapeutic response should therefore be tested in a broader range of IBD patients. The fact that the concordance of the up-regulation of these genes was independent of inflammation per se, supports the clinical significance of this molecular clustering. Establishment of qPCR-based characterisation into UC1 and UC2 presents a more convenient methodology for clinical stratification.
Czarnewski P et al. Nat Commun. 2019 Jun 28;10(1):2892.
West NR et al. Nat Med. 2017 May;23(5):579–589.